
GIS (Geographic Information Systems), GPS (Global Positioning System), RS (Remote Sensing), IT (Information Technology), and ICS (Incident Command System) each play distinct but complementary roles across all phases of disaster management. GIS is used to map hazard zones, analyze spatial patterns of risk and vulnerability, and support decision-making by overlaying data such as population density, infrastructure, and terrain during mitigation, preparedness, response, and recovery.
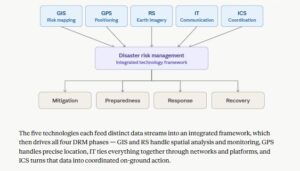
GPS provides precise location and navigation data, enabling accurate positioning of affected areas, tracking of relief vehicles and personnel, and guiding search-and-rescue teams to disaster sites. RS, through satellites and aerial imagery, offers real-time or near-real-time monitoring of disaster events like floods, wildfires, cyclones, and earthquakes, helping assess damage extent and monitor changes in land cover before and after an event. IT underpins the entire system by enabling data storage, communication networks, early warning dissemination, databases, and software platforms that integrate GIS, GPS, and RS data for analysis and coordination. Finally, ICS provides the organizational framework and standardized command structure that coordinates personnel, resources, and communication among multiple agencies during an emergency response, ensuring that the technical data from GIS, GPS, RS, and IT is translated into effective, coordinated on-ground action.
Role of GPS (Global Positioning System) in Disaster Risk Management
GPS (Global Positioning System) plays a critical role across all phases of Disaster Risk Management—mitigation, preparedness, response, and recovery—primarily by providing precise, real-time location and timing data that supports mapping, navigation, tracking, and early warning systems.
Key Roles of GPS in Disaster Risk Management
- Hazard Mapping and Vulnerability Assessment: GPS is used alongside GIS to create accurate base maps, geo-reference hazard-prone zones, and identify vulnerable populations and infrastructure before disasters strike.
- Early Warning Systems: GPS-based sensors monitor ground deformation, tectonic plate movement, and sea-level changes, feeding data into warning systems for earthquakes, tsunamis, and landslides.
- Search and Rescue (SAR) Operations: GPS enables precise location of survivors, rescue teams, and emergency vehicles, drastically reducing response time in the “golden hours” after a disaster.
- Tracking and Coordination of Relief: Relief convoys, ambulances, and supply chains are tracked in real time, ensuring efficient distribution of aid and avoiding duplication or delays.
- Damage Assessment and Evacuation Planning: GPS-tagged data helps in mapping the extent of damage and planning safe evacuation routes for affected communities.
- Post-Disaster Reconstruction: GPS assists in accurately re-establishing property boundaries, rebuilding infrastructure, and monitoring recovery progress over time.
Examples from Past Disasters
- 2004 Indian Ocean Tsunami: Following this disaster, GPS-linked buoys and sea-level sensors became central to the Indian Ocean Tsunami Warning System, allowing scientists to detect abnormal wave patterns and issue alerts to coastal nations.
- 2010 Haiti Earthquake: GPS-enabled mobile mapping and crowd-sourced platforms (like Ushahidi) combined with GPS coordinates helped humanitarian teams locate trapped survivors, damaged buildings, and prioritize rescue operations in Port-au-Prince.
- 2011 Tōhoku Earthquake and Tsunami (Japan): Japan’s dense network of GPS/GNSS stations (GEONET) detected massive ground displacement in real time, which helped refine tsunami models and improve early warning accuracy for future events.
- 2013 Uttarakhand Floods (India): GPS-based tracking was used to guide rescue helicopters and ground teams through difficult Himalayan terrain to locate stranded pilgrims and tourists.
- 2015 Nepal Earthquake: GPS data helped monitor aftershocks and ground movement, while GPS-tagged aerial and satellite imagery assisted in identifying the most severely damaged areas for prioritized relief efforts.
- 2005 Hurricane Katrina (USA): GPS technology was used extensively for search-and-rescue navigation in flooded areas of New Orleans, and for coordinating the movement of emergency responders and supply logistics.
Role of GIS (Global Information System) in Disaster Risk Management
GIS stands for Geographic Information System (not “Global Information System”)—but the role you’re asking about is spot on, so here’s the full explanation.
Role of GIS in Disaster Risk Management
GIS is a system designed to capture, store, analyze, and visualize spatial (location-based) data. In disaster risk management, it acts as the analytical backbone that integrates data from GPS, remote sensing, demographics, and infrastructure into map-based layers, enabling planners and responders to make informed, location-specific decisions across all four phases of disaster management.
- Mitigation and Risk Assessment: GIS overlays hazard data (flood plains, fault lines, wildfire-prone areas) with population density, land use, and infrastructure maps to identify high-risk zones and inform building codes, zoning laws, and insurance risk models.
- Preparedness and Early Warning: GIS supports the creation of evacuation route maps, shelter location databases, and hazard models (e.g., storm surge or flood inundation models) that feed into public warning systems.
- Response and Real-Time Coordination: During an event, GIS integrates live data feeds (weather radar, satellite imagery, 911 calls, social media) into dashboards used by emergency operations centers to allocate resources, track damage, and direct responders.
- Damage Assessment and Recovery: Post-disaster, GIS is used to map damaged structures, estimate economic losses, prioritize rebuilding, and track long-term recovery and mitigation project progress.
-
Examples from Past Major Disasters (Global)
- 2004 Indian Ocean Tsunami: GIS was used extensively in the aftermath to map the extent of coastal destruction across Indonesia, Sri Lanka, India, and Thailand, integrating satellite imagery with population data to direct relief efforts and later to redesign coastal buffer zones and early warning infrastructure.
- 2005 Hurricane Katrina, USA: FEMA and USGS used GIS to map flood extents in New Orleans, overlay levee breach points with population data, and coordinate search-and-rescue grids, later informing the redesign of the city’s flood defense system.
- 2010 Haiti Earthquake: With minimal pre-existing spatial data, humanitarian agencies relied on rapidly crowd-sourced GIS mapping (via platforms like OpenStreetMap and Ushahidi) to locate survivors, map damaged buildings, and coordinate the influx of international aid in Port-au-Prince.
- 2011 Tōhoku Earthquake and Tsunami, Japan: GIS integrated with Japan’s GEONET ground-monitoring network mapped real-time tsunami inundation extents, helping identify the worst-hit coastal towns, guide search-and-rescue operations, and later plan the relocation of communities to higher ground.
- 2013 Typhoon Haiyan, Philippines: GIS-based storm surge and wind models predicted the disaster’s severity in advance, and post-event GIS damage mapping using satellite imagery helped direct one of the largest humanitarian responses in Southeast Asian history.
- 2015 Nepal Earthquake: GIS combined with satellite and drone imagery helped identify the most severely damaged mountain villages, many cut off by landslides, to prioritize helicopter-based relief delivery.
- 2018 Camp Fire, California, USA: CAL FIRE used GIS fire-spread modeling based on terrain, wind, and vegetation data to predict the fire’s path and issue targeted evacuation orders for specific neighborhoods.
- 2019–2020 Australian “Black Summer” Bushfires: GIS was used to track fire perimeters in near real-time, model smoke dispersion, and coordinate the evacuation of both human populations and wildlife rescue efforts across multiple states.
- 2022 Pakistan Floods: GIS combined with satellite flood-extent mapping (from agencies like UNOSAT) showed that nearly a third of the country was underwater, guiding the allocation of international relief resources to the worst-affected districts in Sindh and Balochistan.
Role of Remote Sensing (RS) in Disaster Risk Management
Remote sensing is the science of acquiring information about the Earth’s surface from a distance—typically via satellites, aircraft, or drones equipped with sensors that capture optical, infrared, radar, or thermal data. In disaster risk management, RS provides the wide-area, repeatable observation capability that ground-based methods simply cannot match, making it indispensable across all four phases of disaster management.
- Mitigation and Hazard Assessment: RS is used to map long-term hazard indicators—deforestation patterns, coastal erosion, glacial lake formation, land subsidence, and urban sprawl into flood plains—helping identify areas of growing vulnerability before disasters occur.
- Preparedness and Early Warning: Satellites continuously monitor weather systems, sea surface temperatures, and atmospheric conditions to track the formation and path of cyclones, monsoons, and droughts. Thermal sensors detect wildfire hotspots, while radar altimetry monitors river and reservoir levels for flood forecasting.
- Response and Real-Time Monitoring: During an event, RS provides near-real-time imagery of the affected area—cloud-penetrating radar (SAR) can map flood extent even through storm cover, while optical imagery reveals damage patterns, blocked roads, and isolated communities, guiding search-and-rescue prioritization.
- Damage Assessment and Recovery: Post-disaster, before-and-after satellite image comparisons (change detection) allow rapid, large-scale damage assessment across entire regions, helping estimate economic losses, prioritize reconstruction, and monitor environmental recovery over months or years.
Examples of the Effective Role of Remote Sensing in Disaster Management
Here are remote sensing examples for past disasters with concrete data points drawn from satellite-based assessments.
- 2022 Pakistan floods
Satellite radar and optical imagery (Copernicus Sentinel-1, Landsat 8/9, VIIRS) showed roughly one-third of the country underwater — an area comparable to the state of Colorado or half the size of France. UNOSAT’s satellite-based water detection found about 85,000 km² of land affected by floodwater within an 800,000 km² analysis area, including 56,000 km² of flooded cropland, with at least 33 million people exposed or living close to the flooded zones. Follow-up satellite monitoring also documented more than 1 million houses damaged or destroyed, around 150 bridges and 3,500 km of roads destroyed, and over 700,000 livestock and 2 million acres of crops lost. - 2023 Turkey–Syria earthquake
NASA’s ARIA team used Sentinel-1 SAR imagery from before (Feb 9) and after (Feb 21) the event to generate ground-displacement maps showing how the Earth’s surface moved, with blue areas indicating land movement away from the satellite and red areas movement toward it. The Copernicus Emergency Mapping Service tasked high-resolution optical satellites, including Pléiades imagery covering 664 km² across more than 20 areas of interest, to grade building damage. Combined satellite and ground assessments put the toll at more than 55,000 deaths, 3 million people displaced in Turkey and 2.9 million in Syria, and at least 230,000 buildings damaged or destroyed.
Role of Information Technology and Computer Science in Disaster Management
Information Technology (IT) and Computer Science provide the computational backbone that ties together GIS, GPS, and remote sensing data into usable systems—covering everything from databases and networks to artificial intelligence, cloud computing, and mobile applications. While GIS/GPS/RS generate spatial data, IT and CS are what store, process, analyze, transmit, and act on that data at scale, making them essential across all four phases of disaster management.
Key Roles
- Data Management and Integration: Databases and data warehouses store and organize massive volumes of hazard, demographic, and infrastructure data, enabling agencies to query and cross-reference information (e.g., who lives in a flood zone, which hospitals are operational) in seconds rather than days.
- Early Warning Systems and Communication Networks: IT infrastructure powers alert dissemination—SMS-based warnings, cell broadcast systems, sirens triggered by sensor networks, satellite communication for areas with damaged infrastructure, and public alert apps.
- Artificial Intelligence and Machine Learning: CS-driven algorithms increasingly predict disaster risk (flood forecasting models, wildfire spread prediction, earthquake aftershock probability), automatically detect damage in satellite imagery (using computer vision/deep learning), and power chatbots or triage systems during emergency response.
- Cloud Computing and Big Data: Cloud platforms allow massive datasets (satellite imagery, sensor feeds, social media) to be processed and shared in real time across agencies and countries without requiring every organization to own supercomputing infrastructure.
- Emergency Operations Software and Dashboards: Custom software integrates live data feeds into unified dashboards used by Emergency Operations Centers (EOCs) to visualize the disaster, allocate resources, and coordinate multiple responding agencies—often built on top of GIS but requiring significant software engineering to function reliably under crisis load.
- Crowdsourcing and Social Media Analytics: CS techniques (natural language processing, sentiment analysis) mine social media and crowdsourced reports (e.g., Twitter/X, Facebook, community apps) to detect emerging incidents, verify needs, and locate survivors faster than official channels alone.
- Simulation and Modeling: Computational models simulate disaster scenarios—flood inundation, tsunami wave propagation, evacuation traffic flow, epidemic spread—allowing planners to test preparedness strategies before a real event occurs.
- Post-Disaster Recovery and Resilience Planning: Databases and analytics platforms track long-term recovery metrics, insurance claims processing, and reconstruction progress, while IT systems help rebuild damaged digital infrastructure (hospital records, government services) itself.
Examples from Past Disasters
- 2010 Haiti Earthquake: The crowdsourcing platform Ushahidi, combined with volunteer-driven OpenStreetMap mapping, became one of the most cited examples of CS/IT in disaster response—crowdsourced SMS reports were geotagged and mapped in near real time, helping responders locate trapped survivors when official data infrastructure had collapsed.
- 2011 Tōhoku Earthquake and Tsunami, Japan: Japan’s J-Alert system used IT networks to broadcast earthquake and tsunami warnings via TV, radio, cell broadcast, and public loudspeakers within seconds of detection—critical given the minutes-long window residents had to evacuate.
- 2017 Hurricane Harvey, USA: Social media (particularly Twitter and Facebook) became a real-time distress signal system, with residents posting locations needing rescue; volunteer-built tools scraped and mapped these posts, supplementing official 911 systems that were overwhelmed.
- 2018–2025 California Wildfires: Machine learning models (e.g., Google’s wildfire boundary tracking used in Google Maps/Search) automatically detect and map fire perimeters using satellite data, feeding real-time updates to the public and emergency responders without manual mapping delays.
- COVID-19 Pandemic (2020–2022): Though a biological rather than natural disaster, it showcased IT/CS at massive scale—dashboards like Johns Hopkins’ COVID tracker aggregated global case data in real time, while epidemiological simulation models informed lockdown and resource allocation policies worldwide.
- 2023 Turkey–Syria Earthquake: AI-based building damage detection algorithms processed satellite imagery within hours to flag likely collapsed structures, helping prioritize search-and-rescue teams in an area too large to assess manually in the critical early hours.
- Various recent disasters: Cloud-based platforms like Esri’s ArcGIS Online and Microsoft’s AI for Humanitarian Action increasingly let responding agencies spin up shared, real-time common operating pictures within hours of an event, rather than building bespoke systems from scratch each time.